
Healthcare's 4.15-Star Average Masks a 31.7% High-Churn-Risk Rate
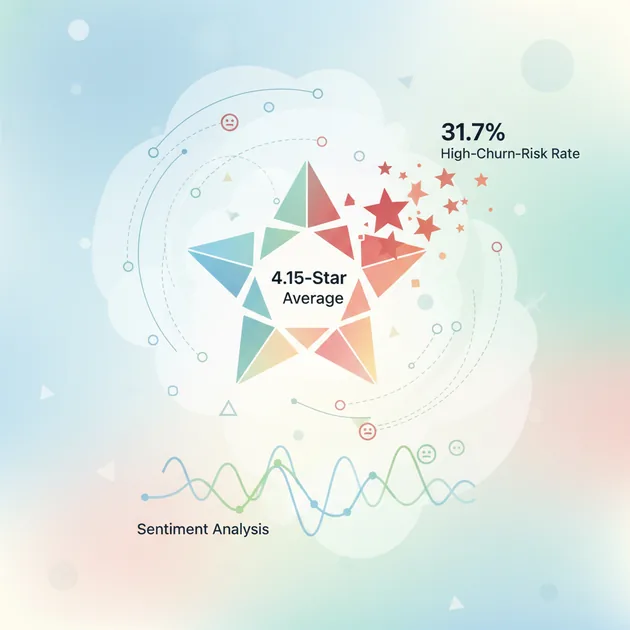
Healthcare & Medical companies average 4.15 stars — a number that on its face looks like an industry in good shape. But dig into churn-risk scoring across the 41 companies analyzed, and 31.7% of them fall into the high-churn-risk category, compared to a 24.2% average across the rest of the platform. In other words, nearly a third of healthcare providers are sitting on customer relationships that are quietly at risk, even while their public star ratings suggest otherwise.
High-Churn-Risk Rate: Healthcare vs. Platform
How Can Ratings Be High and Churn Risk Also Be High?
The two metrics measure different things. Star ratings reflect what customers say after a single visit or interaction — often colored by recency, prompted reviews, or a particularly good or bad appointment. Churn-risk scoring, by contrast, weighs patterns across sentiment, service consistency, and engagement signals to estimate whether a customer relationship is likely to end. A patient can leave a five-star review after a good checkup and still be one bad billing experience away from switching providers. That gap is exactly what shows up in the industry's overall score average of 53.6 — a mid-range number that sits well below what a 4.15-star average alone would imply.
The Spread Between Best and Worst Is Enormous
The industry-wide averages hide a genuinely wide spread once you look at individual companies. At the top, Lash Eye Care Ltd posts a 96.7 overall score on a 4.99-star average across 100 reviews, and Kernow Ear Health hits a full 5.0-star average. At the bottom, Apria Healthcare scores 12.1 with a 1.15-star average, and HM Hospitales sits at 12.3 with 1.6 stars. That's not a narrow band of performance — it's a nearly 85-point swing in overall score within the same industry, which suggests churn risk in healthcare has less to do with the sector itself and more to do with how individual practices manage the patient experience.
Best vs. Worst Overall Score
High-Churn-Risk Rate: Healthcare vs. Platform Average
| Category | Value (%) |
|---|---|
| Healthcare & Medical | 31.7% |
| Platform average | 24.2% |
What Separates the Top Performers From the Bottom
Looking at named companies on both ends makes the pattern concrete. HealthSource Medical Associates (94.1 score, 4.99 stars), Dr. Bri's Vibrant Pelvic Health (94.1 score, 4.98 stars), and Future Family (94.0 score, 4.74 stars) all cluster near the top with consistent, high review volume. At the other end, Apollo-Optik (11.1 score, 2.52 stars) and Futtermittelintoleranz (11.7 score, 2.52 stars) show that low scores aren't limited to companies with just a handful of reviews — Apollo-Optik alone has 100 reviews backing its 2.52-star average, meaning its poor standing reflects a sustained pattern rather than a few bad experiences.
Overall Score: Top vs. Bottom Healthcare Companies
| Category | Value (score) |
|---|---|
| Lash Eye Care Ltd | 96.7 score |
| HealthSource Medical Associates | 94.1 score |
| Future Family | 94 score |
| HM Hospitales | 12.3 score |
| Apria Healthcare | 12.1 score |
| Apollo-Optik | 11.1 score |
The Reply Rate Story: Slightly Better Engagement, Still High Risk
Healthcare actually replies to reviews more often than the platform average — a 30.0% reply rate compared to 23.9% platform-wide, across the 34 companies with sufficient engagement data. That's a genuinely positive signal on paper. But the average reply takes 283.2 hours, or nearly twelve days, to arrive. A patient who leaves a frustrated review about billing or wait times isn't likely to feel reassured by a response that lands nearly two weeks later, and it appears that responding more often doesn't offset responding slowly when it comes to churn risk.
Healthcare Reply Rate vs. Platform
This mirrors a pattern seen across many service industries: response speed tends to matter as much as, or more than, whether a response happens at all. Customers who feel heard quickly are more likely to stay, while a slow or generic reply — even a well-intentioned one — can read as indifference. Healthcare's high reply rate paired with a nearly twelve-day average response time is a useful reminder that engagement metrics need to be read together, not in isolation.
Takeaway
A 4.15-star average tells you healthcare patients are, on the whole, satisfied with individual interactions. It does not tell you that nearly a third of the industry's companies are carrying elevated churn risk, or that the gap between the best and worst performers spans more than 80 points in overall score. For an industry built on long-term patient relationships, that combination — decent surface ratings, slow response times, and a churn-risk rate running well above the platform average — is worth watching closely rather than reading past.
The companies clustering near the top, like Lash Eye Care Ltd and Kernow Ear Health, aren't necessarily bigger or better-resourced — they're simply more consistent across the metrics that actually predict retention. That consistency, more than the star rating alone, is what separates healthcare providers built for the long term from those quietly losing patients.
<i>This analysis is based on CustomerEye's free-tier, rule-based review analytics: star ratings, sentiment scoring, churn-risk scoring, response-rate/response-time metrics, and ten-category theme sentiment scoring. The Healthcare & Medical figures draw from 41 companies analyzed for churn risk (with 34 having sufficient data for engagement metrics), out of 1,000 companies in the broader industry pool. No AI-generated commentary was used in computing any number in this article — every statistic traces directly to the underlying rule-based analysis; the surrounding prose was written by an LLM for readability only.</i>
See your own trend
Look up any analyzed company and check the direction behind the rating.
Explore companies